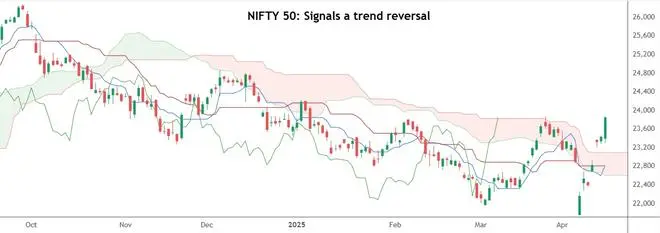
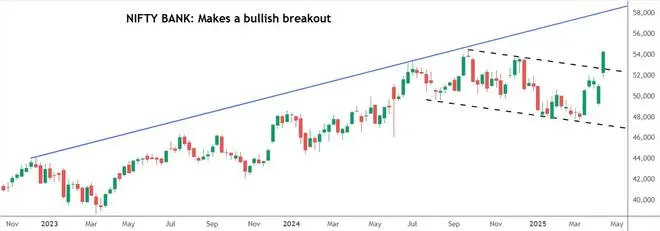
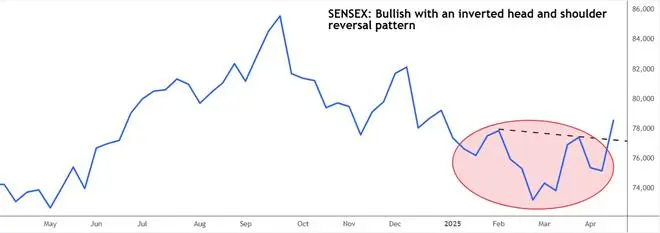
Nifty 50, Sensex and the Nifty Bank indices surged in the truncated trading last week. Nifty 50 and Sensex were up about 4.5 per cent each. The Nifty Bank index outperformed with a strong 6.5 per cent rally. The strong rise over the last two weeks indicates that the Indian benchmark indices could be gearing up for a trend reversal, and a fresh rally.
All the sectoral indices closed in green last week. The BSE Realty and the BSE Bankex surged the most. They were up 7.08 per cent and 6.66 per cent respectively.
Reversal chart pattern
Nifty and Sensex are looking bullish with an inverted head and shoulder pattern on the daily line chart. The Nifty Bank index on the other hand made a bullish breakout above a crucial resistance last week. Overall, charts indicate that the long-term uptrend is beginning to resume.
We reiterate that any fall in the coming weeks will once again give an opportunity to enter the market from a long-term perspective.
FPIs buy
Foreign Portfolio Investors bought the Indian equities last week. The equity segment saw a net inflow of about $990 million. If the FPIs increase their purchase quantum, then that would aid the Sensex and Nifty to rise further in the days ahead.
Video Credit: Businessline
Nifty 50 (23,851.65)
Nifty broke the crucial resistance at 23,200 and surged towards 23,900 as expected. The index touched a high of 23,872.35 before closing the week at 23,851.65, up 4.48 per cent.
Short-term view: A crucial resistance is in the 23,950-24,000 region. If this resistance holds on its first test, a pullback move to 23,400 or 23,300-23,200 is possible. However, a fall beyond 23,200 is less likely as fresh buyers can come into the market and limit the downside.
We expect the Nifty to sustain above 23,300 itself and breach 24,000 eventually. Such a break can take the Nifty up to 24,400-24,500 initially. A further break above 24,500 will then clear the way for the Nifty to target 24,850-25,000 in the short term.
The short-term view will turn negative only if the Nifty declines below 23,200. If that happens, a fall to 22,700 can be seen. However, such a fall looks unlikely.

Chart Source: TradingView
Medium-term view: Our long-term bullish view remains intact. We reiterate that a break above 24,000 can take the Nifty up to 25,000-26,000 initially. It will also strengthen the bullish case for the Nifty to target 28,000-28,500 by this year-end or early next year.
The bullish outlook will get negated only if the Nifty declines below 21,650 which looks unlikely now. In case 24,000 caps the upside for now, the broad 21,650-24,000 range can remain intact for some more time.
Nifty Bank (54,290.20)
Nifty Bank index broke above 52,000 as expected. The index surged and indeed has risen well beyond our expected level of 54,000. It made a high of 54,407.20 on Friday and closed the week at 54,290.20, up 6.45 per cent.
Short-term view: The bullish breakout above 53,000 and a decisive weekly close indicate that the momentum is strong. The region between 53,000 and 52,500 will now act as a strong support and limit the downside. There is no major resistance ahead. A break above 54,500 will see the Nifty Bank index targeting 58,000-58,500 in the short term.
The index has to fall below 52,500 to delay the aforementioned rally. In that case, a fall to 51,500-51,400 can be seen. For this fall to happen, the Nifty Bank index has to fail in its attempt to breach 54,500 immediately.
However, we do not expect a break below 52,500. In case the index fails to breach 54,500, it can consolidate in a sideways range of 52,500-54,500 for some time. Thereafter the bullish breakout above 54,500 can happen.

Chart Source: TradingView
Medium-term view: Our broader bullish view remains intact. Indeed, the rise above 52,500 last week confirms the same. Our earlier mentioned target of 58,000-58,500 looks likely to be achieved much faster than expected. From a long-term perspective, this leg of rally has the potential to take the Nifty Bank index up to 61,000.
Sensex (78,553.20)
Sensex surged breaking above 77,500 last week as expected. The index touched a high of 78,616.77 and closed the week at 78,553.20, up 4.52 per cent.
Short-term view: Immediate resistances are at 78,750 and 79,100. Sensex can breach 79,100 which can boost the bullish momentum. Such a break can take the Sensex up to 82,000-82,300 in the short term.
If Sensex fails to breach 79,100, a corrective dip to 77,400 or 77,200 is a possibility. A fall beyond 77,200 looks less likely.

Chart Source: TradingView
Medium-term view: We retain our broader bullish view. As mentioned last week, the break above 79,100 will strengthen the bullish case. It will take the index up to 85,000-86,000 initially. An eventual break above 86,000 will see the Sensex targeting 90,000 and even 92,000 in the next three-four quarters.
We stress that 70,800 is the crucial support. Sensex has to decline below this level to become bearish. That looks unlikely now.
Dow Jones (39,142.24)
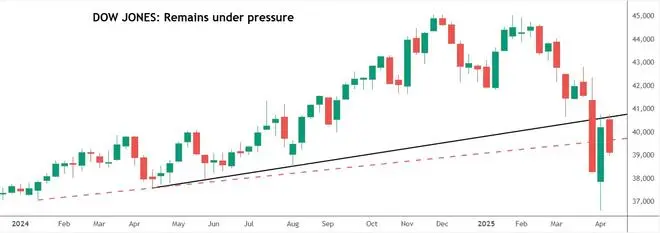
The first resistance level of 40,800 mentioned last week has capped the upside in the Dow Jones Industrial Average. The index rose to a high of 40,791.18 and reversed lower giving back all the gains. The Dow Jones has closed the week at 39,142,24, down 2.66 per cent.

Chart Source: TradingView
Outlook: The view remains bearish. Resistance is at 39,650 which can cap the upside from here. Immediate support is at 38,870. The Dow Jones looks vulnerable to break this support and fall to 38,200-38,000 again.
Broadly, we expect the Dow to oscillate in a range of 38,000-41,000 for a few weeks.
The index will come under more selling pressure if it declines below 38,000. If that happens, the Dow can fall to 36,500-36,200.
Published on April 19, 2025


